PPS Divestment by Neighborhood, Illustrated
by Steve, August 24th, 2007I’ve written before about how Portland Public Schools’ open transfer policy causes segregation and divestment of state tax revenue from poor neighborhoods and funnels it to wealthier neighborhoods. I’ve called for a New Deal for PPS that will and redirect state funding to reinvest in these neighborhoods.
My harping on these points has caused some confusion. After all, doesn’t PPS actually spend more per student in the poorer schools? Yes, of course they do. But the point is that as families take advantage of PPS’s open transfer policy, millions of dollars follow them out of poorer neighborhoods, landing in the wealthier, whiter neighborhoods. Left in their wake are segregated schools with fewer “specials”, electives and extra-curricular activities, and under constant threat of closure, No Child Left Behind sanctions, and “reorganization” (read charter schools, alternative schools, and ill-advised grant-funded experiments).
Below is a map illustrating the reverse-Robin Hood pattern of divestment in Portland’s neighborhoods. Areas of red had a net loss of funding when compared to area PPS student population in 2006-07 (that is, of all PPS students living in the attendance areas of schools in that ZIP code, fewer actually attend schools in that ZIP code). The areas of green had a net gain. The darker the color, the greater the loss or gain. The gray areas were close enough to call “gray” (+/- $200,000 per year); 97204 (in white) has no schools.
(Click map for a larger view.)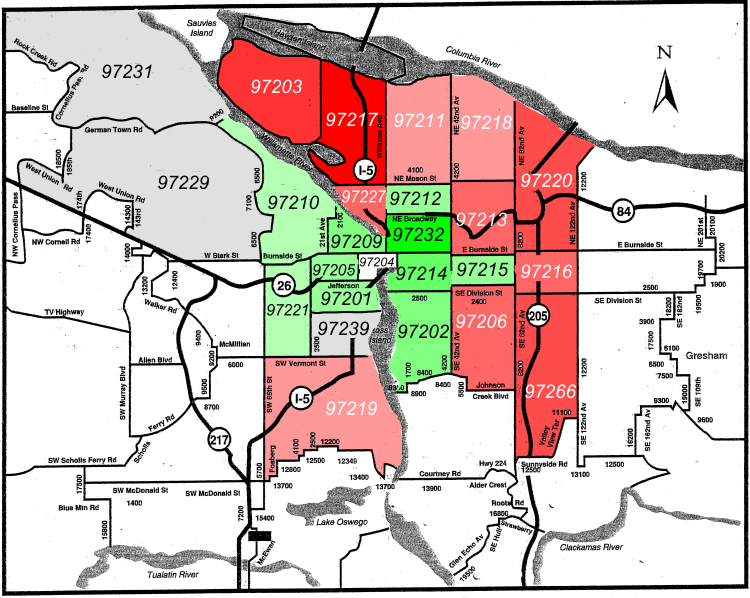
The big winner in the PPS funding switcheroo is 97232, largely due to the presence of Benson and da Vinci (which, as special focus schools, do not have attendance areas). This part of Portland gained an additional $8.9 million in state funding last school year.
Other areas of note are 97214, the beneficiary of an extra $3.1 million, 97209 at $2 million, 97202 at $1.6 million, 97212 at $2 million, and 97215 at $1 million.
The losers, as most of us not in the “green zone” are already painfully aware, are stuck footing the bill. North Portland’s 97217 has bled the most, with a loss of $8.2 million last school year. Over in St. Johns, in 97203, they lost $5.7 million. Outer Northeast’s 97213 lost $1.7 million. Out in the nether-reaches of the east-side, 97216 lost $2 million, 97206 lost $2.7 million, and 97220 lost a whopping $4.3 million. There are more.
This is the legacy of Portland Public Schools’ open transfer policy: Segregated schools and divestment from working-class neighborhoods.
It’s time our school leaders acknowledge that this policy is flawed at best. Unfortunately, recent leadership foibles have only exacerbated the problems.
We have a unique opportunity in Portland, with its thriving and integrated urban neighborhoods, to create a truly equitable and integrated system of neighborhood public schools. The first step is to correct this funding imbalance, and guarantee that every neighborhood school offers opportunities on par with every other neighborhood school. Nothing less will do.
Source and methodology notes: All statistics are gathered from Portland Public Schools 2006-2007 Enrollment Profiles. (I have extracted the PPS data to a single spread sheet in order to more easily collate the data.)
School funding loss/gain is computed by subtracting the neighborhood PPS population from the number of students attending the school, then multiplying it by the budget per student at that school. For example, at Ainsworth, there were 509 students, 317 PPS students in the attendance area, and $4334 spent per student. So (509-317)*4334 = $832,128.
Schools like Marshall High, with multiple schools within the school, were calculated as follows. First I computed the total spent in the entire school by multiplying the number of students in each sub-school by that sub-school’s budget per student. Then I calculated a per-student budget for the entire school, and used that number as a multiplier of the difference between the total school population and the attendance area PPS population.
PPS does not publish funding per student for its charter schools, so it is impossible to include them in this study.
Net losses and gains do not add up to zero, because of differences in per-pupil funding by school.
I may have made some mistakes along the way, either in extracting the data, collating them, or in putting them on the map. If you find any errors, I’d appreciate hearing about them!


